Test Runs
Execute your user stories as automated tests, monitor real-time progress, and analyze results to keep your application healthy.
On this page
Running Tests
From a project's Testing Dashboard, click the Run Tests button to start a new test run. You will be prompted to configure a few settings before execution begins.
Configuration options
- Base URL — The URL of the application to test. This is where the browser automation will navigate to begin executing your stories.
- Story Selection — Choose which user stories to include in the run. You can select all stories or pick specific ones.
- Timeout — Maximum time (in seconds) to allow for each story's execution before marking it as timed out.
- Fail-Fast Mode — When enabled, the test run stops immediately after the first story failure instead of continuing with remaining stories.
- Authentication — Optional. Provide a Bearer token or custom headers if your application requires authentication to access the pages under test.
Test runs execute stories in parallel using AI-powered Playwright browser automation. Each story is run in an isolated browser context to prevent state leakage between tests.
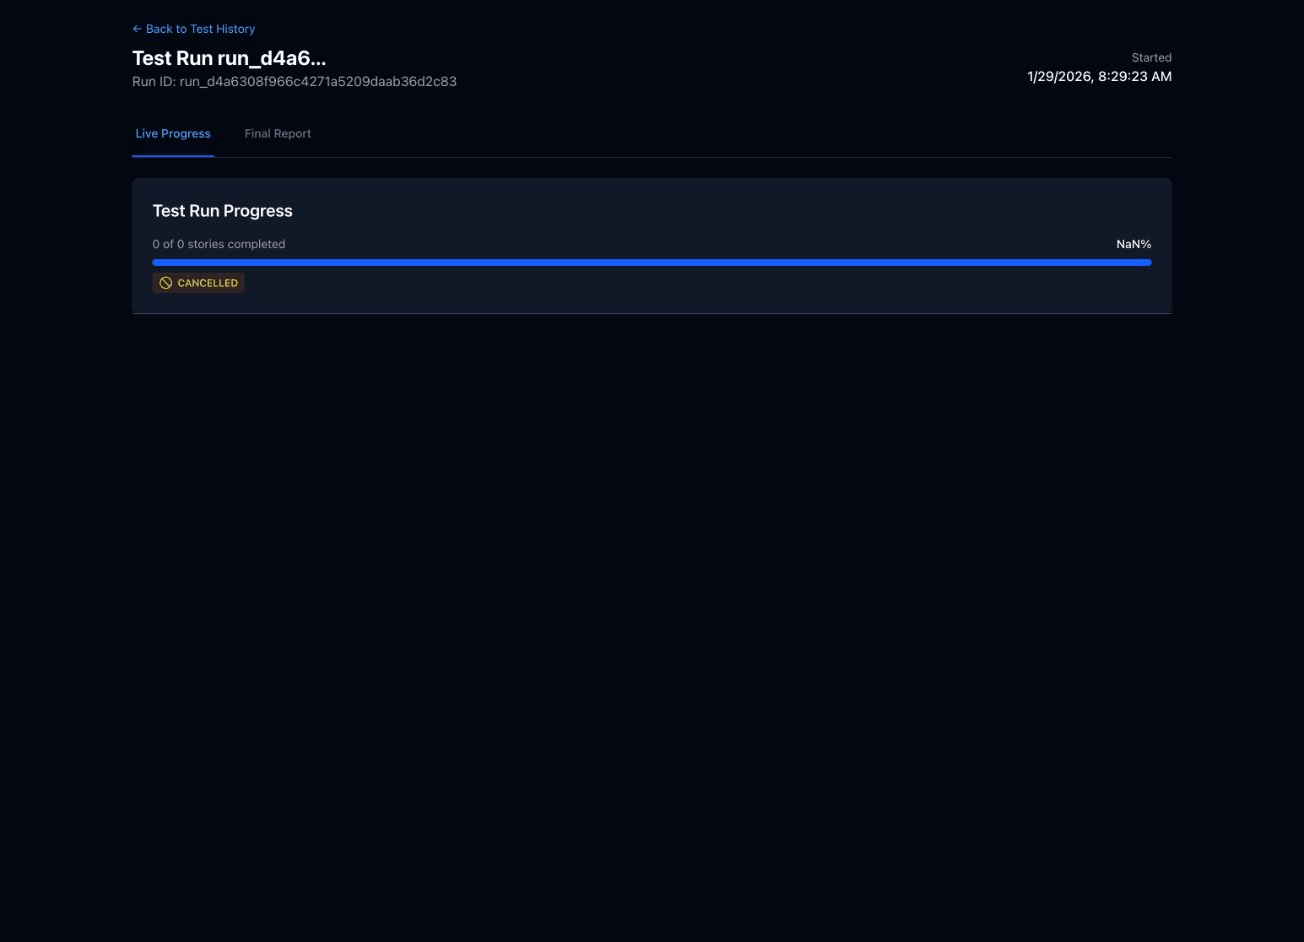
Test Progress
After starting a test, you are taken to the real-time progress view where you can monitor execution as it happens.
What you will see
- Overall Progress Bar — A horizontal bar showing the percentage of stories completed, updated in real time.
- Per-Story Status — Each story displays its current state: pending, running, passed, or failed.
- Live Log Output — Expand any story to see step-by-step log messages as the browser automation executes actions.
- Elapsed Time Counter — Shows how long the test run has been executing since it started.
You can cancel a running test at any time by clicking the Cancel button. Stories that have already completed will retain their results.
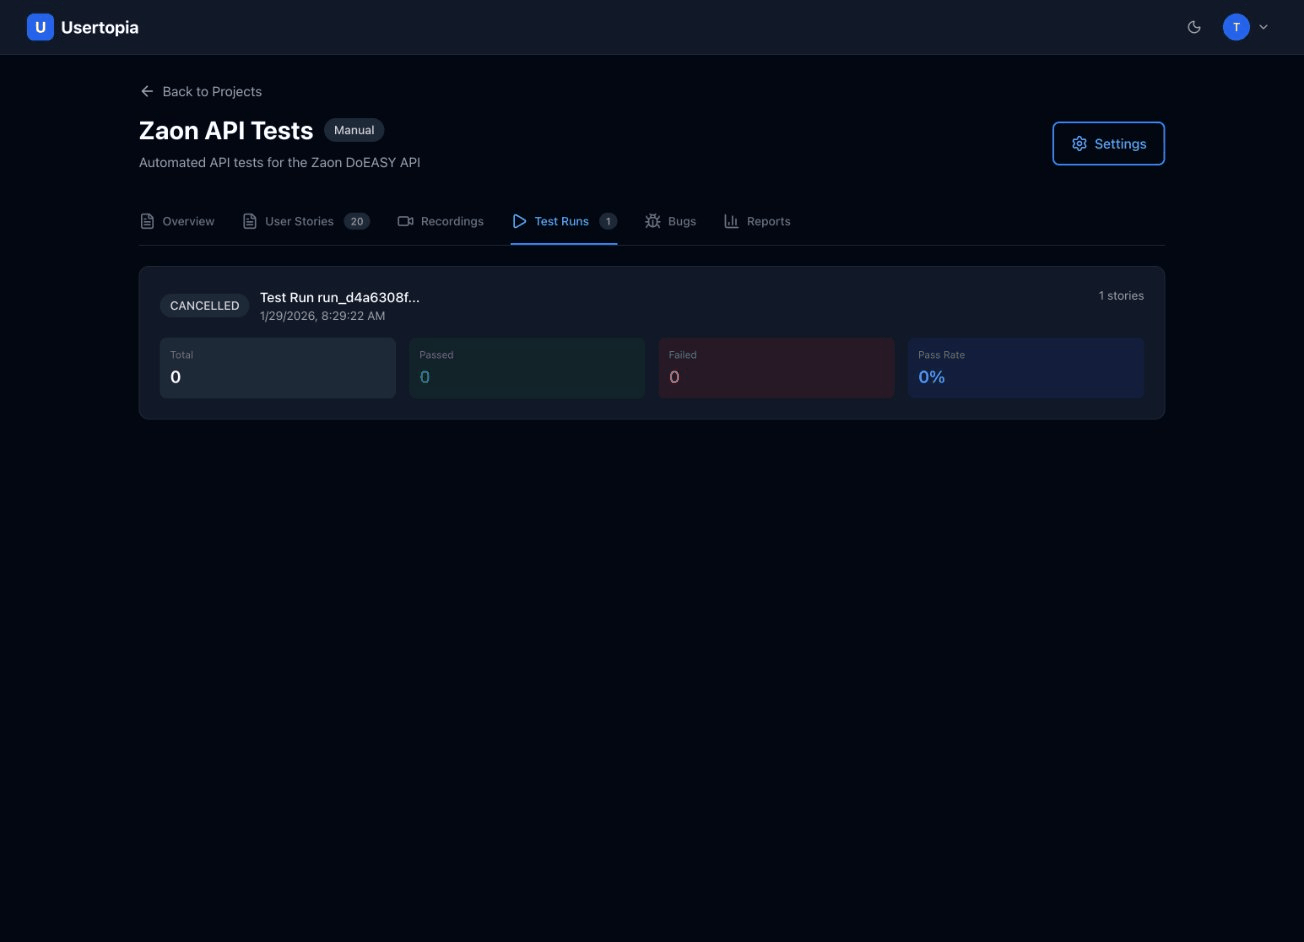
Test Results
After a test run completes, you can view a detailed breakdown of every story that was executed.
Results summary
At the top of the results page, you will see a summary card with key metrics:
12
Total Stories
10
Passed
2
Failed
83%
Pass Rate
Per-story details
Below the summary, each story is listed with expandable details. Click a story to reveal:
- Execution time — how long the story took to complete.
- Status — passed, failed, or error with a color-coded badge.
- Error details — for failed stories, the specific assertion or step that failed along with an error message.
- Screenshots — images captured during execution, including the state of the page at the point of failure.
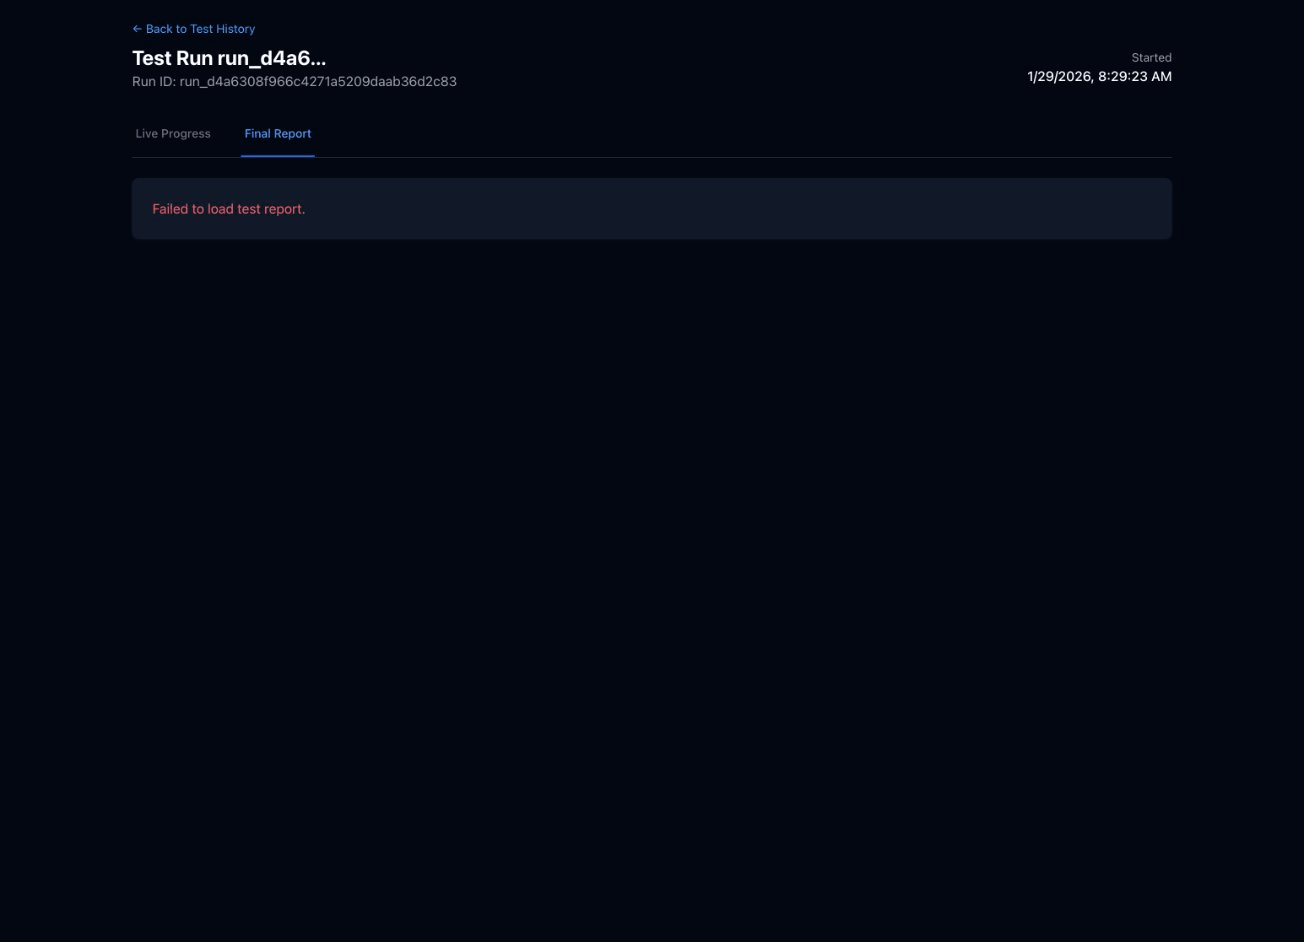
Test Reports
Every test run automatically generates a structured markdown report that you can view within the app or export for sharing with your team.
Report contents
- Summary statistics — total stories, pass/fail counts, overall pass rate, and total duration.
- Detailed results per story — each story's outcome, execution time, and any errors encountered.
- Error analysis — aggregated view of failure patterns to help you prioritize fixes.
- AI-generated insights — Usertopia analyzes your failures and provides suggestions about common root causes and recommended next steps.
Tip: AI-generated insights look across your recent test runs to identify recurring failure patterns, such as a flaky element selector that fails intermittently or an API endpoint that returns errors under load.
Test History
The Test History page shows all past test runs for a project in a sortable, filterable table. Use it to track trends and catch regressions over time.
Filtering and comparison
- Filter by date to narrow results to a specific time range.
- Filter by status — show only passed, failed, or cancelled runs.
- Compare results across runs to track regression trends and measure improvements over time.
Table columns
Each row in the history table displays the following information:
| Run Name | Date | Stories | Pass Rate | Duration |
|---|---|---|---|---|
| Nightly Regression #47 | Jan 29, 2026 | 12 | 100% | 2m 14s |
| Nightly Regression #46 | Jan 28, 2026 | 12 | 83% | 3m 02s |
| Checkout Flow Check | Jan 27, 2026 | 4 | 100% | 0m 58s |
Understanding Test Statuses
Each story in a test run goes through one or more of the following statuses during execution:
| Status | Badge | Description |
|---|---|---|
| Pending | Pending | Test is queued and waiting to start execution. |
| Running | Running | Test is currently executing in the browser. |
| Passed | Passed | All assertions succeeded. The story completed without errors. |
| Failed | Failed | One or more assertions did not pass. Review error details for specifics. |
| Cancelled | Cancelled | Test was manually cancelled by a user before completion. |
| Error | Error | Test encountered an unexpected error (e.g., infrastructure timeout, browser crash). |
Tips for Reliable Tests
Follow these best practices to get the most consistent results from your test runs.
Use specific CSS selectors or data-testid attributes
Avoid fragile selectors that depend on DOM structure. Instead, add data-testid attributes to key elements in your application and reference those in your stories.
Set appropriate timeouts for slow-loading pages
If your application loads data asynchronously or has heavy pages, increase the timeout setting to prevent false failures caused by slow network responses.
Use the wait task type between page transitions
When a user action triggers a navigation or significant DOM change, add a wait task to give the page time to stabilize before the next assertion.
Keep stories focused on one flow
Each user story should test a single end-to-end flow (e.g., "User logs in" or "User completes checkout"). This makes failures easier to diagnose and keeps test execution fast.
Use variable chaining to pass data between tasks
When one task produces a value that a later task needs (e.g., a login token returned by an API call), use variable chaining to capture and inject that value automatically. See the User Stories & Tasks documentation for details.